
This primer shows how to use the Mac OS X debugger included in IDA 5.1. Before we start, please download this archive:
- macvuln.tgz - a sample vulnerable Mac OS X application which will be used in this primer
Unpack the debugger server files to any directory on Mac OS X. The debugger server is stand-alone and it is not necessary to have installed the OS X version of IDA to use it. For this tutorial, we will use the Windows version of IDA. But, if you prefer, you may also use the Mac OS X version of IDA, or even the Linux version, they offer the same functionalty.
In order to connect to other applications and debug them, we first have to set the appropriate permissions for the debugger server: we need to make it setgid "procmod". Here is how to do it:
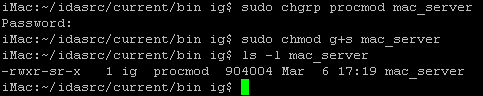
Please note the 's' bit in the file permissions. The file group should be "procmod". We are now ready to launch the the debugger server:
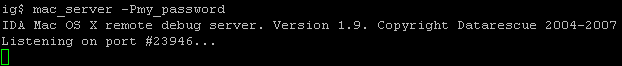
We're all set! We can either create new processes or attach to existing ones. Do not forget to protect your debugger server from the outside world. If you forget to password-protect it, anyone can connect to the debugger server and launch any program on the machine. If your debugger server is directly accessible from the Internet (a strategy we do not recommend!), or if you are working in a sniffable local environment, consider adding encryption such as a SSH tunnel to prevent password sniffing.
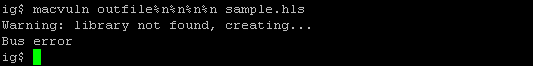
Lets now take a look at our somewhat artificial macvuln demo application. We modified the tool we use to generate IDA message files to make it vulnerable. If you run it with a malformed output file name, it crashes:
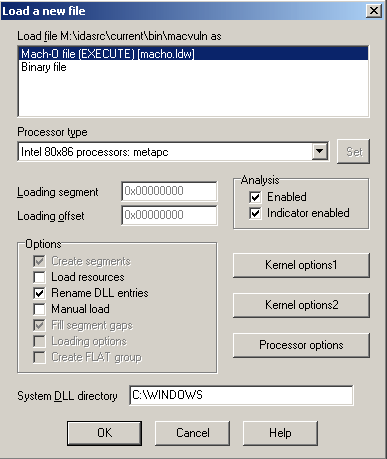
Let's start IDA on our Windows machine and see if we can figure out what causes the crash. We begin our session by loading the macvuln file into the database:
and set the process options in the Debugger,cess options dialog box:
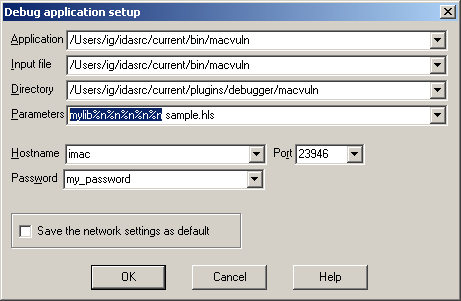
In this dialog we explicitly specify all fields because, unfortunately, IDA can't read minds yet! Well, except for the port number when it happens to use the default value...
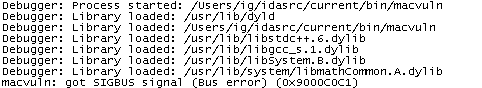
Let's go for a first quick run: we will just launch the application and let it crash. This is the easiest way to locate the crash address. Pressing F9 will start the application and the immediate result will be a message box about a SIGBUS signal. The message window will contain this:
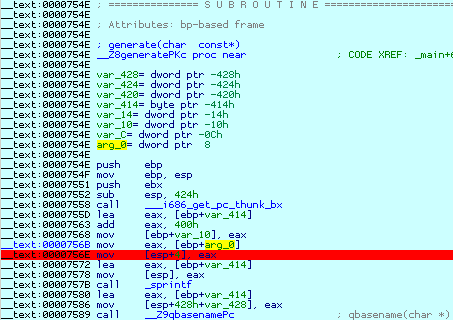
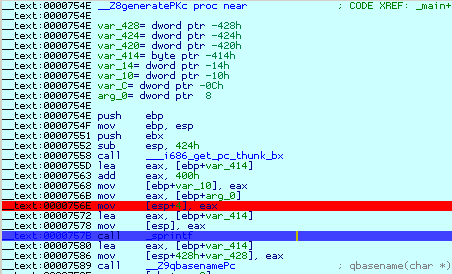
To find out where the sprintf function was called from, we open the stack trace window (Debugger, Tracing, Stack trace):
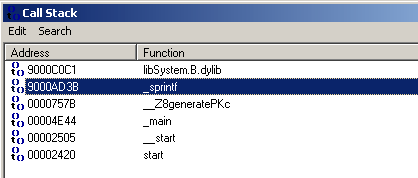
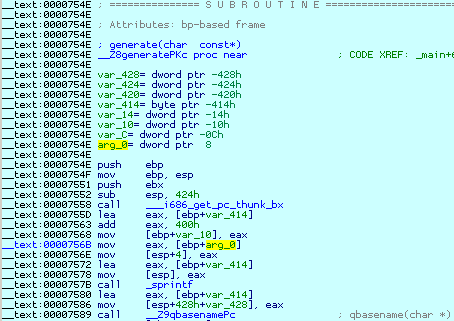
Obviously, the supplied command line argument has been used as a format string to the sprintf function. Double clicking on the next line (with the address 757B on it) will display the offending code:
Let's rerun the application and suspend it just before the sprintf call. This will allow us to verify our guess about the format string. Terminate the current debugger session with Ctrl-F2 (Terminate process), create a breakpoint with F2 (Toggle breakpoint) and restart the debugger with F9:
When the execution reaches our breakpoint, we double click on the eax register to inspect the memory it points to:

This confirms our guess - yes, the output file name is used as a format string. Congratulations, you have just discovered your first, somewhat artificial, vunerability in a Mac OS X application! Just out of curiosity, we could single step until the call instruction by pressing F7:
If we press F8 to step over, the application will crash. Now that we know what will happen, we better stop the debugger and fix the application (or analyze other applications to find more bugs ;)