IDA Pro
A powerful disassembler, decompiler and a versatile debugger. In one tool.


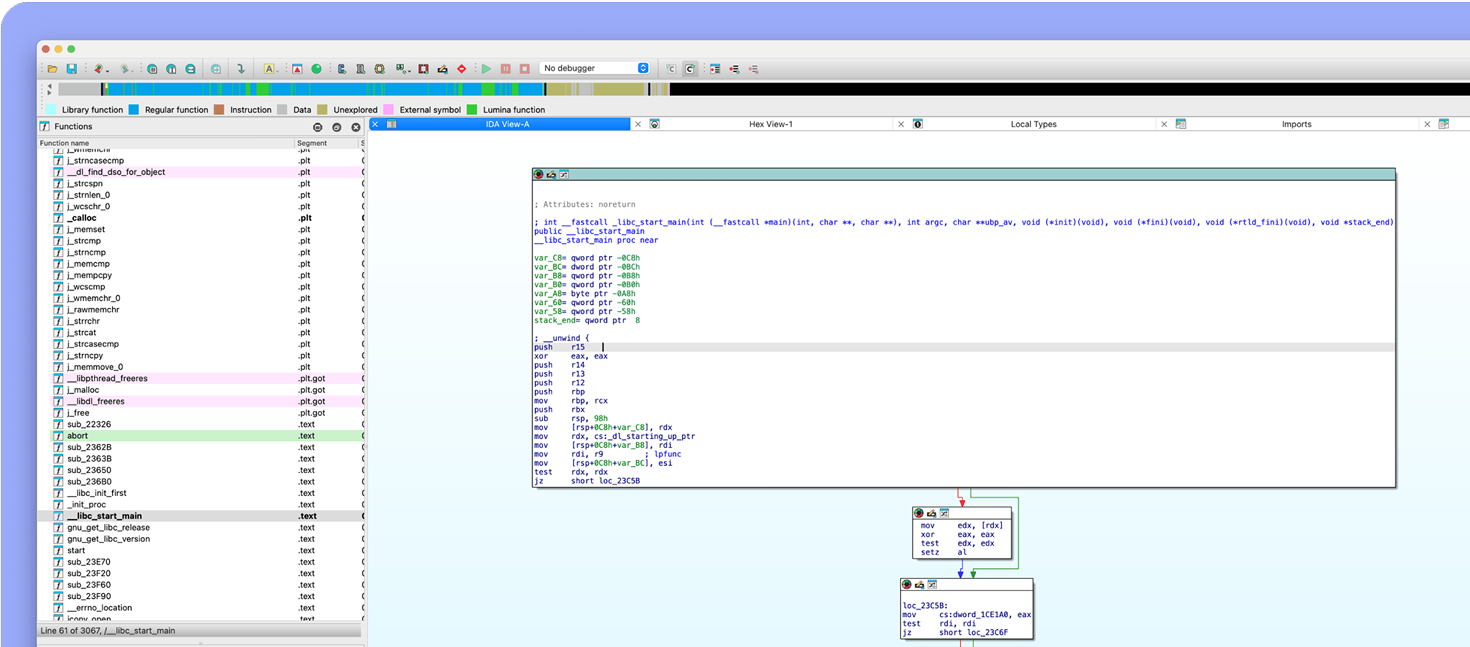
IDA decompilers focus on delivering code that is readable, maintainable, and semantically similar to the original source code thanks to high-level abstractions, semantic preservation, readability, type inference, structure recovery and more.
Explore IDA Decompilers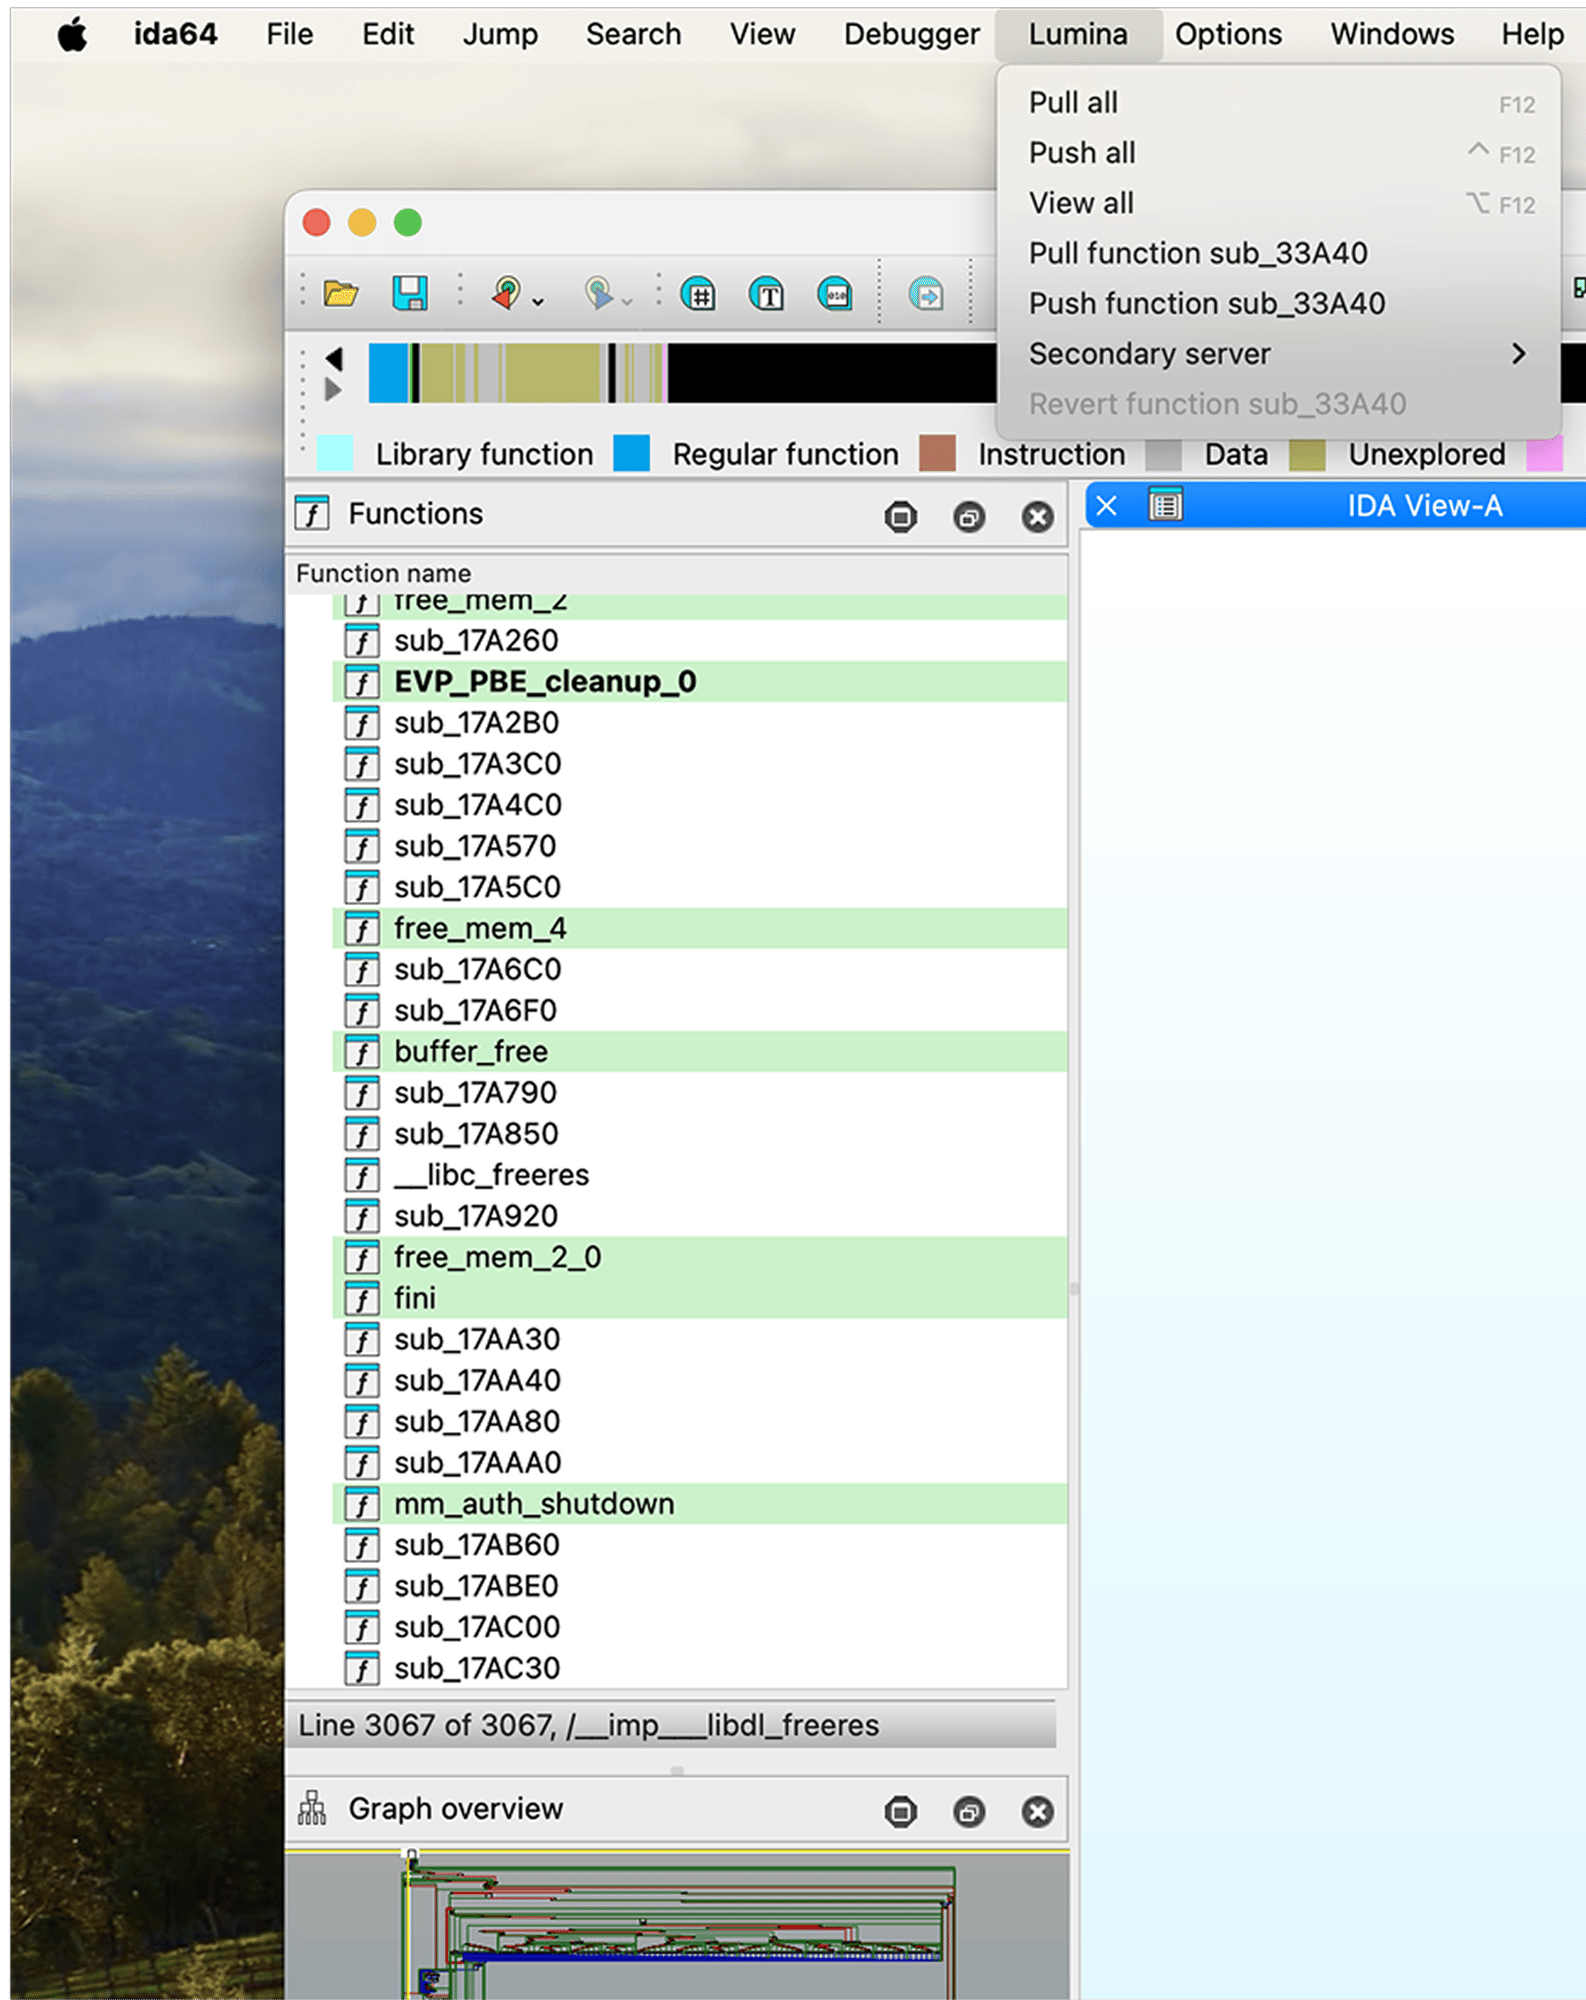
The Public Lumina server by Hex-Rays tracks metadata for functions, like names or operand types. Your IDA instance exchanges only hashes and metadata, avoiding sensitive byte patterns. To control your metadata, enable the Private Lumina add-on for a self-hosted server.
Discover Lumina
We use FLIRT (Fast Library Identification and Recognition Technology) to help reverse engineers identify libraries used in a binary. All to boost the readability of generated disassemblies.
Explore FLIRTSee IDA in action. Kickstart with a lightweight Free
version or pick up a robust IDA Pro.


Connect with the community on
© 2026 Copyright Hex-Rays