Suppose our goal is to dissect a new program. The ultimate method of analysis is single stepping the program of interest. Each executed instruction must be single stepped at least once so we won’t miss anything important.
Single stepping is generally easy but if the program uses SEH exceptions to hide its logic, it is becomes more difficult. It is not obvious from the listing where the exception handler resides and what it will do. All what we get when an exception happens it its name and some additional information like the current EIP. Luckily the debugger gets the exception notifications before the application and we can pass the exception to the application or mask it at our will.
Since we do not want to disturb the program behavior we will pass all exceptions to the application:
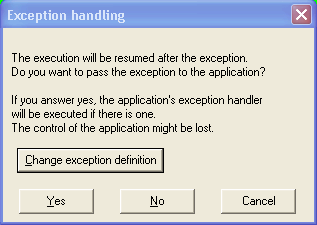
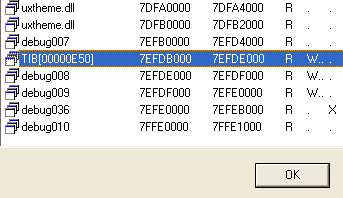
Do NOT press Yes if you want to single step the exception handler. We will need to set an additional breakpoint at the beginning of the exception handler and get control as soon as the system executes it. For that we will start with the Task Information Block. It has a dedicated segment (press Ctrl-S to open this window, see TIB in the segment name):
Let’s convert the first dword of this segment to an offset (press O):
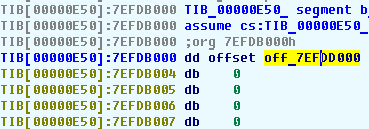
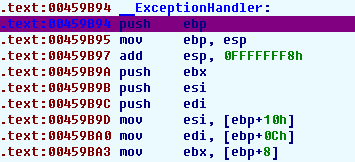
and follow it by pressing Enter. We will find another dword at the target address. It contains another offset in its turn. This sequence of dwords is part of the exception handler chain. After each dword there is a pointer to an exception handler. We will pick the first exception handler since it will get control:
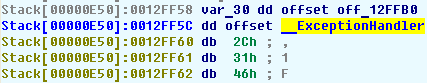
We found the exception handler and can put a breakpoint at it. After that we can press F9, pass the exception to the application, and and continue single stepping at the handler:
That’s how we get into an exception handler. Now let’s consider the problem of returning to the ‘normal’ application execution from it.
If we single step through the whole exception handler and it finishes its work, we will find ourselves in ntdll.dll. We do not want to single step the system kernel, much faster is to skip it and continue in our program. The NtContinue() function is used to resume the execution. It looks like this:
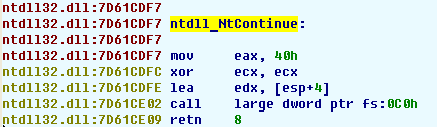
Single stepping this function would not work and we would lose control! The call gate would let the program run at full speed.
We need to find out the EIP which will be assigned to the program by the system and put a breakpoint there.
The NtContinue() function takes one parameter – the process context structure. This structure contains the values of all processor registers to be used after the exception. EIP register is also present in this structure.
Let’s open the structures window (Ctrl-F9) and insert (Ins) a new structure called CONTEXT:
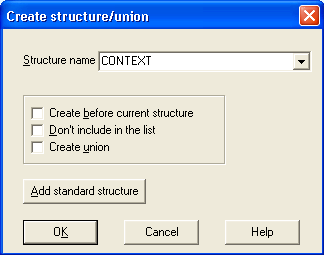
IDA knows about this structure and will complete the definition for us.
The next step is to apply the context structure to the address pointed by the parameter of NtContinue():
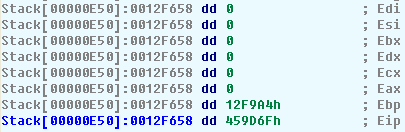
Now the new EIP is visible and clearly commented. We only need to put a breakpoint at it and press F9 to return to our application from the exception handler.
This is how we return from an exception handler.
We learned how to get into an exception handler and return from it. By the way, when we return, we could check the processor registers and if the application has thrashed some of them (thrashed hardware debug registers?) we could restore them. Also, when we enter the exception handler, we could erase the debug register values so that the application can not check them to detect the debugger.
Ah yes, almost forgot to tell you: these actions can be automated and hooked to a hotkey…. Nice plugin idea, isn’t it? 🙂
